



View Any GitHub Repository Folder Structure Online — No Cloning Required
Every developer has been there. You find a GitHub repo you want to explore — maybe a popular open-source library, a project you're thinking of contributing to, or someone's boilerplate you want to reference. And the first question is always: how is this thing actually structured?
GitHub's default interface only shows you one folder at a time. You click into src, then into components, then back, then into utils. For large codebases that's a slow, frustrating exercise in clicking just to build a mental picture of how everything fits together.
The GitHub File Tree Visualizer fixes that. Paste any GitHub repo URL, hit the button, and you get the complete interactive folder structure in your browser — instantly, for free, no setup, no cloning.
Generate an Interactive GitHub Directory Tree for Public and Private Repositories
The tool works for both public and private repositories. For public repos you don't need to sign in at all — just paste the URL and go. For private repos, connect your GitHub account and the tool fetches the tree using your credentials, respecting your existing access permissions.
You can also target any specific branch. By default it picks your repo's default branch automatically, but if you want to visualize a dev, staging, or any feature branch, just type it in. Useful when different branches have significantly different structures and you want to document or compare a specific one.
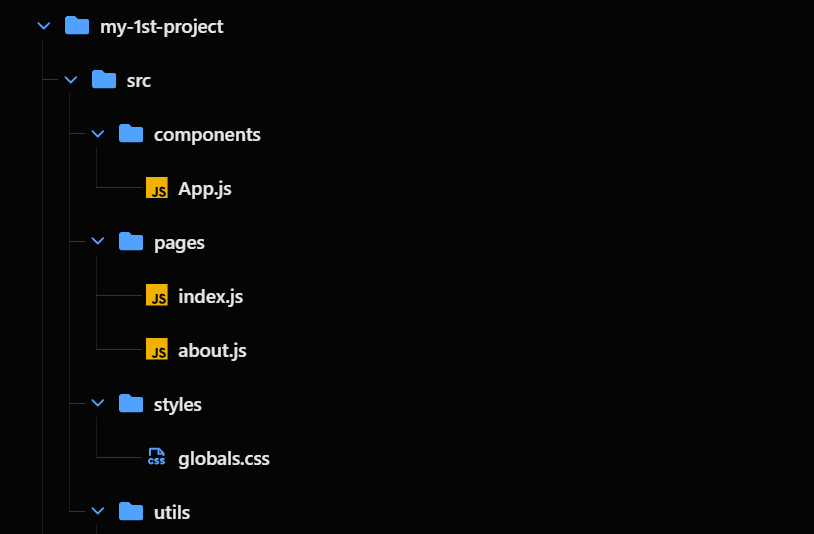
The tree itself is interactive. Every folder expands and collapses on click. Files show icons based on their actual type — TypeScript files get the TypeScript logo, React components get the React icon, Dockerfiles, Python files, Go files, YAML configs, JSON — all have their own icons so you can scan the structure visually without reading every filename carefully. Folders always appear before files, and everything inside each level is sorted alphabetically, which is exactly how most developers expect a file tree to look.
How to Visualize a GitHub Repo's Folder Structure — Step by Step
The whole process takes about fifteen seconds. Here's what you do:
- Paste the GitHub repository URL into the input at the top — something like
https://github.com/vercel/next.jsor any valid GitHub repo link. - Enter a branch name if you need a specific one. Leave it blank and it defaults to the repo's main branch automatically.
- Click Visualize. The tool fetches the complete file list and builds the nested, collapsible tree in your browser.
- Browse the tree. Expand and collapse folders by clicking. Use the built-in search to find a specific file in a large codebase without scrolling through hundreds of entries. Click any file to view its raw contents in a dialog, right there on the page.
- Copy or export. Grab the tree as plain text, Markdown, or JSON with one click. Paste it directly into your README, your docs, or wherever you need it.
- Edit the structure if you want. Click "Edit Folder Structure" to open it in the Folder Structure Editor, where you can rename, add, or remove entries and export terminal commands to recreate the structure locally.
Copy GitHub Repo File Tree as Markdown for Your README — One Click
The most common reason developers use this tool is to grab a clean copy of a project's folder structure to paste into a README or documentation. The export options are built around that use case.
Plain text gives you the classic ASCII tree — the same format you'd get from running tree in your terminal. Clean lines, proper indentation, file names. Paste it anywhere.
Markdown wraps the tree in a fenced code block, ready to drop straight into a .md file. It renders correctly on GitHub, GitLab, Notion, and any other Markdown-based platform.
JSON gives you the structured tree data as a nested object — useful if you're processing it programmatically or building something on top of it.
A good project README always includes a folder structure section. It helps contributors understand where things live before they open a single file, reduces onboarding time, and makes your project look well-maintained. This tool generates that section for any repo in seconds.
Search Inside Any GitHub Repository File Tree Without Downloading It
Large repos — think microsoft/vscode or facebook/react — have hundreds or even thousands of files. Once you've generated the tree, you don't want to scroll through all of it looking for one specific file.
The built-in search filters the tree in real time as you type. Start typing a filename and the tree narrows down to just the matching entries, with their full folder path preserved so you know exactly where in the repo they live. It's the fastest way to find something in a large codebase you've never worked in before.
Deep Repository Analytics
Beyond the file tree, the tool also pulls in a full repo summary so you can evaluate the project without switching tabs:
- Stars, forks, and open issues — the core health signals of any repo, right at the top.
- Commit Activity Heatmap — a visual graph charting the project's commit frequency over the last 52 weeks to easily spot development momentum.
- Pull Request Analytics — see how many PRs are open versus merged, and check the average PR merge time to gauge maintainer responsiveness.
- Issue Labels & First Issues — instantly view a breakdown of the repository's top issue tags (bugs, enhancements) and find "Good First Issues" specifically highlighted for new contributors.
- Tech Stack & Repo Size — visual progress bars showing exact language percentages (TypeScript, Python, Rust, etc.) along with the total physical size of the repository.
- Contributor count — how many people have committed to the project, which tells you something about community size and how actively it's maintained.
- Created date and last push date — immediately tells you whether the project is actively maintained or has been sitting untouched for two years.
- npm dependencies and dev dependencies — if the repo has a
package.json, the tool shows you every package it depends on with direct links to their npm pages. No need to open the file yourself. - Issues explorer — browse, search, and filter the repo's GitHub issues by open or closed state, sort by most recent or most commented, and read issue details including labels, author, and date — all without leaving the tool.
- Forks explorer — see who has forked the repo, how many stars their fork has, when it was last updated, and what language it uses. Sortable by stars, forks, watchers, or date.
This makes the tool a lightweight repo explorer, not just a file tree generator. You can evaluate a project pretty thoroughly before deciding whether to use it, fork it, or contribute to it.
How to Switch Between File Tree and Interactive Node Graph Views
Sometimes a standard nested directory list isn't enough to understand complex project architectures. That's why the visualizer offers multiple ways to display a GitHub repository:
- Interactive Tree View: The classic nested directory structure. Perfect for exploring files, finding specific components, and clicking through to view raw file contents right in the browser.
- Node Graph View: A visual, force-directed graph representation of the repository. This view treats folders and files as interconnected nodes, allowing you to visually explore the depth and density of different directories. It's the best way to spot massive utility folders or deeply nested monoliths at a single glance.
- Mermaid Diagram View: Automatically generates Mermaid.js compatible code representing your repository. This is incredibly useful for embedding dynamic, diagrammatic representations of your folder structure into Notion, GitHub wikis, or any platform that supports Mermaid rendering.
- ASCII Text View: A plain-text fallback that mimics the terminal
treecommand exactly, ensuring you have a clean, non-interactive version ready to copy-paste. - Emoji Tree View: A fun, visual alternative to standard ASCII text that replaces structural branches with emojis (📁 for folders, 📄 for files, etc.), making it highly readable and visually distinct for documentation.
You can toggle between these modes at any time using the view toggle buttons located at the top right of the file tree panel.
Calculate Repo Health Scores
Every repository is scored out of 100 points across four categories: Activity, Community, Maintenance, and Documentation. No points are awarded as a baseline — every point is earned based on real signals from the repository.
Category Breakdown
The 100 points are distributed across four categories. Activity and Maintenance carry the most weight because they reflect the current state of the project, not just its history.
- Activity — 35 points
- Maintenance — 30 points
- Community — 25 points
- Documentation — 10 points
Activity — 35 Points
Activity measures how recently and consistently the repository receives code updates. It is the strongest individual signal of a healthy project.
Recency of last push (25 pts)
This checks the date of the most recent push to the repository. A push within the last 30 days scores the full 25 points. The score drops as the gap grows: 18 points for 31–90 days, 10 points for 91–180 days, 4 points for 181–365 days, and 0 points if the last push was more than a year ago.
Total commit volume (10 pts)
This checks the total number of commits in the repository's history. 500 or more commits scores 10 points. 100–499 scores 7, 50–99 scores 4, 10–49 scores 2, and fewer than 10 scores 0. A high commit count indicates an established project with sustained development over time.
Community — 25 Points
Community measures how widely the repository is adopted and how many people contribute to it. Stars and forks reflect passive interest; contributors reflect active involvement and are weighted most heavily.
Stars (8 pts)
1,000 or more stars scores 8 points, 500–999 scores 6, 100–499 scores 3, 10–99 scores 1, and fewer than 10 scores 0.
Forks (7 pts)
100 or more forks scores 7 points, 20–99 scores 4, 5–19 scores 1, and fewer than 5 scores 0. Forks indicate the project is being extended, studied, or used as a base by others.
Contributors (10 pts)
Contributors are the most meaningful community signal. A higher contributor count means lower bus factor, broader code review, and a project less dependent on a single person. 20 or more contributors scores 10 points, 5–19 scores 7, 2–4 scores 4, and a solo project scores 1.
Maintenance — 30 Points
Maintenance measures how actively the repository is managed. This category has no baseline — a completely inactive repository with no CI scores 0.
Active team signal (15 pts)
This checks whether multiple contributors have pushed code within the last 60 days. A repository pushed within 60 days by more than one contributor scores 15 points. A repository pushed within 60 days by a single maintainer scores 5 points. If the last push was more than 60 days ago, this scores 0 regardless of contributor count.
Issue resolution (5 pts)
When closed issue data is available, this uses the closure rate: closed issues divided by total issues. A closure rate of 80% or above scores 5 points, 50–79% scores 3, and 20–49% scores 1. If closed issue data is unavailable but there are open issues, the repository scores 3 points as a proxy signal that real users are filing feedback. No issue activity at all scores 0.
CI/CD presence (10 pts)
This checks whether GitHub Actions workflows exist in the repository. Automated testing and deployment pipelines are a strong indicator of engineering discipline. A repository with CI/CD detected scores 10 points; one without scores 0. Note that non-GitHub CI systems such as CircleCI or Jenkins may not be detected via the GitHub API.
Documentation — 10 Points
Documentation checks for the two minimum requirements every public repository should have. A README scores 5 points — without it, users have no way to understand what the project does. A LICENSE scores 5 points — without it, the legal status of contributions and usage is undefined.
Grades
The final score is the sum of all four categories. Grades are assigned based on the following thresholds.
- A+ — 85 to 100. Excellently maintained with a very active community.
- A — 75 to 84. Well maintained and actively developed.
- B — 60 to 74. Good. Regular updates and decent community.
- C — 45 to 59. Average. Could use more updates or engagement.
- D — 25 to 44. Needs attention. Low activity and small community.
- F — 0 to 24. Inactive or unmaintained.
What the Score Does Not Measure
The score reflects maintenance health and community adoption, not code quality. A well-scored repository may still have bugs, poor architecture, or security issues. A low-scored repository may be intentionally archived, complete, or a personal tool that simply does not need ongoing updates.
Scores are most meaningful for projects older than six months. A brand new repository will score low by design — it has no commit history, no community, and no issue activity yet.
Add Folder Structures to READMEs
If you're building your own project and want to add a folder structure section to your README.md, this is the fastest way to do it. Paste your own repo URL, wait a second for the tree to load, copy it as Markdown, paste it in. Done.
A folder structure section in a README typically looks like this:
my-project/
├── src/
│   ├── components/
│   │   ├── Button.tsx
│   │   └── Card.tsx
│   ├── pages/
│   │   └── index.tsx
│   └── utils/
│       └── helpers.ts
├── public/
│   └── favicon.ico
├── package.json
└── README.md
This kind of structure overview helps anyone landing on your project — a potential contributor, a recruiter, a teammate — understand how the code is organized without having to clone anything. It's one of those small things that separates a polished README from a bare-minimum one.
If you want to tweak the tree before using it — remove build folders, add planned directories, rename things to match your docs — click "Edit Folder Structure" and make those changes in the editor before copying.
Real Developer Use Cases
These are the situations where developers reach for this tool:
- Before contributing to an open-source project. Understanding a project's architecture before writing a single line of code is good practice. The file tree gives you the map — where tests live, where components are, how the project separates concerns — without having to clone and explore locally.
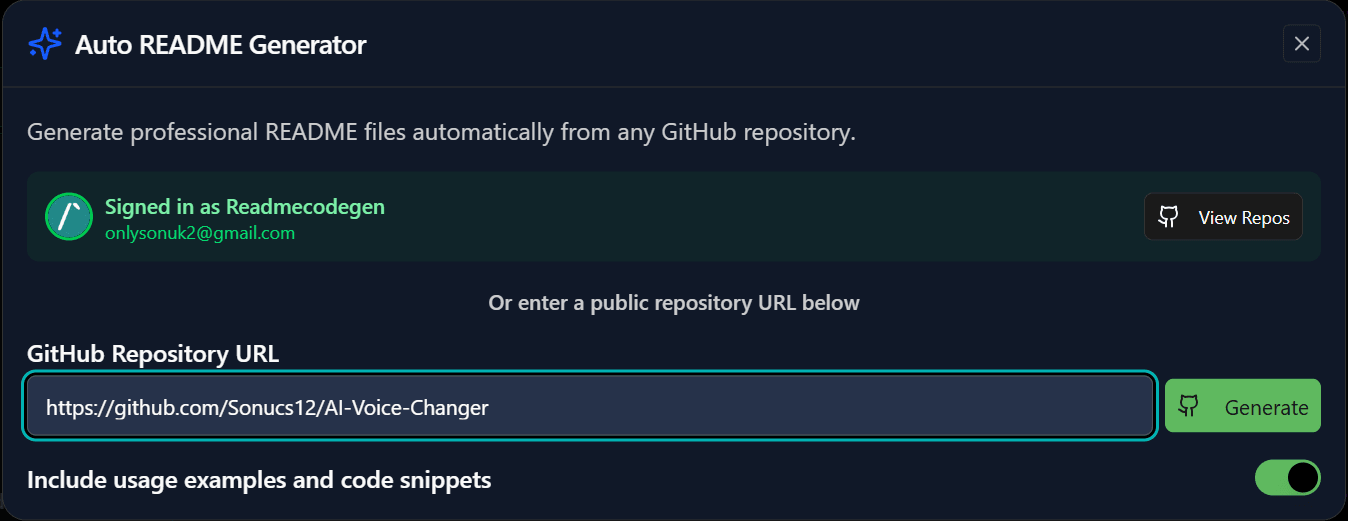
- Writing README files with ReadmeCodeGen's README builder. Visualize your repo's tree, copy the Markdown, and drop it straight into your README file or into the README builder. Thirty seconds and it looks polished.
- Code reviews and architecture discussions. Instead of describing a structure in a Slack message, paste the tree. It's instantly clearer.
- Evaluating a library before adding it as a dependency. Check how the library is organized, whether it has tests, whether the source looks clean — without pulling the whole thing down.
- Comparing how two projects structure similar things. Open two tabs, visualize both repos, look at how they each handle routing, state management, or component organization. It's one of the better ways to learn from well-maintained codebases.
- Technical writing and tutorials. If you're writing a tutorial about a codebase, the folder structure is usually one of the first things you explain. Generate it here, paste it into your article.
- Students and bootcamp learners. New developers learning to navigate large codebases often struggle because they can't see the full picture at once. The visual tree makes repos like
next.jsorcreate-react-appmuch less intimidating.
Export to Folder Structure Editor
After visualizing a repo, clicking "Edit Folder Structure" opens the tree in ReadmeCodeGen's dedicated Folder Structure Editor. This is where things get genuinely useful for project planning work.
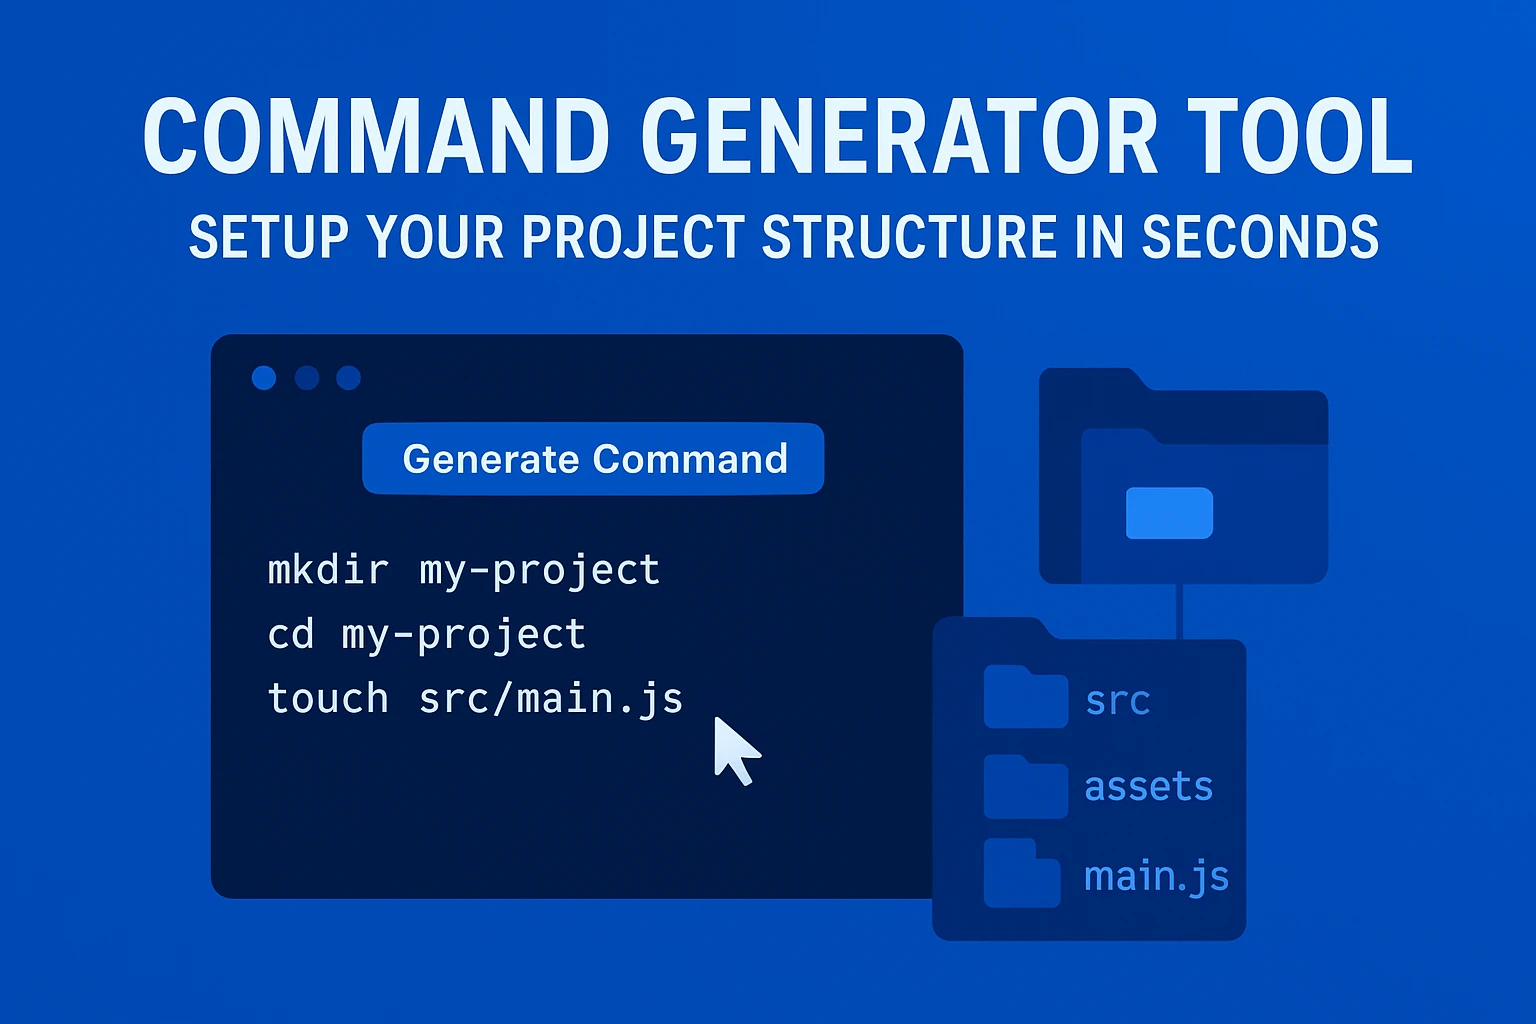
In the editor you can rename any file or folder, add new entries that don't exist in the repo yet, remove things you don't want in your documentation, and then export the whole thing as a shell script — a single set of mkdir and touch commands that recreates the entire structure locally. Share it with a teammate and they can set up the same structure in seconds.
This makes the visualizer the start of a workflow rather than a one-and-done lookup. You explore, you shape it to what you need, you export it exactly how you want it.
More Free GitHub Tools
The GitHub File Tree Visualizer is one tool in a broader set of free developer tools built around GitHub documentation and project presentation. If you're here for the file tree, you might also find these useful:
- GitHub README Generator — build a complete, professional README using drag-and-drop sections, live Markdown preview, and AI writing assistance. No signup required.
- GitHub Profile README Generator — create a standout GitHub profile page with animated skill charts, social links, and interactive elements.
- Changelog Generator — generate a properly formatted
CHANGELOG.mdfrom your commit history or by entering release notes manually. Follows the Keep a Changelog format. - Folder Structure Generator — build a custom folder tree from scratch instead of starting from a real repo. Drag and drop to organize it, then export as Markdown or shell commands.
- OG Image Generator — generate Open Graph images for your project's website or docs. Paste your title and description and get a properly sized image ready for your
<meta>tags.
All tools are free. No account required to use the core features.